Performance
Built for dense market data.
Render millions of data points at a flawless 60 FPS without browser lag. Real chart workflows powered by a highly optimized, raw HTML5 Canvas engine.
The high-performance open source charting library that developers love using. Integrate once, deploy everywhere. Zero dependencies.
Performance
Render millions of data points at a flawless 60 FPS without browser lag. Real chart workflows powered by a highly optimized, raw HTML5 Canvas engine.
Ownership
No iframes, no bloated external dependencies. Start with our core runtime, integrate seamlessly, and build your own custom UI controls around the chart.
Developer Experience
Enjoy a first-class developer experience with strict type-checking, comprehensive autocompletion, and a predictable lifecycle architecture.
Release & Reliability
Trusted in high-stakes financial environments and built by Benzinga Award winners. Shorter guidance, cleaner defaults, and examples that help you launch faster.
Start with the runtime. Add the React controls when they save time. Keep the surface self-hosted either way.
React / Next.js / Vanilla JS
Dashboards / Trading surfaces / Embedded analytics
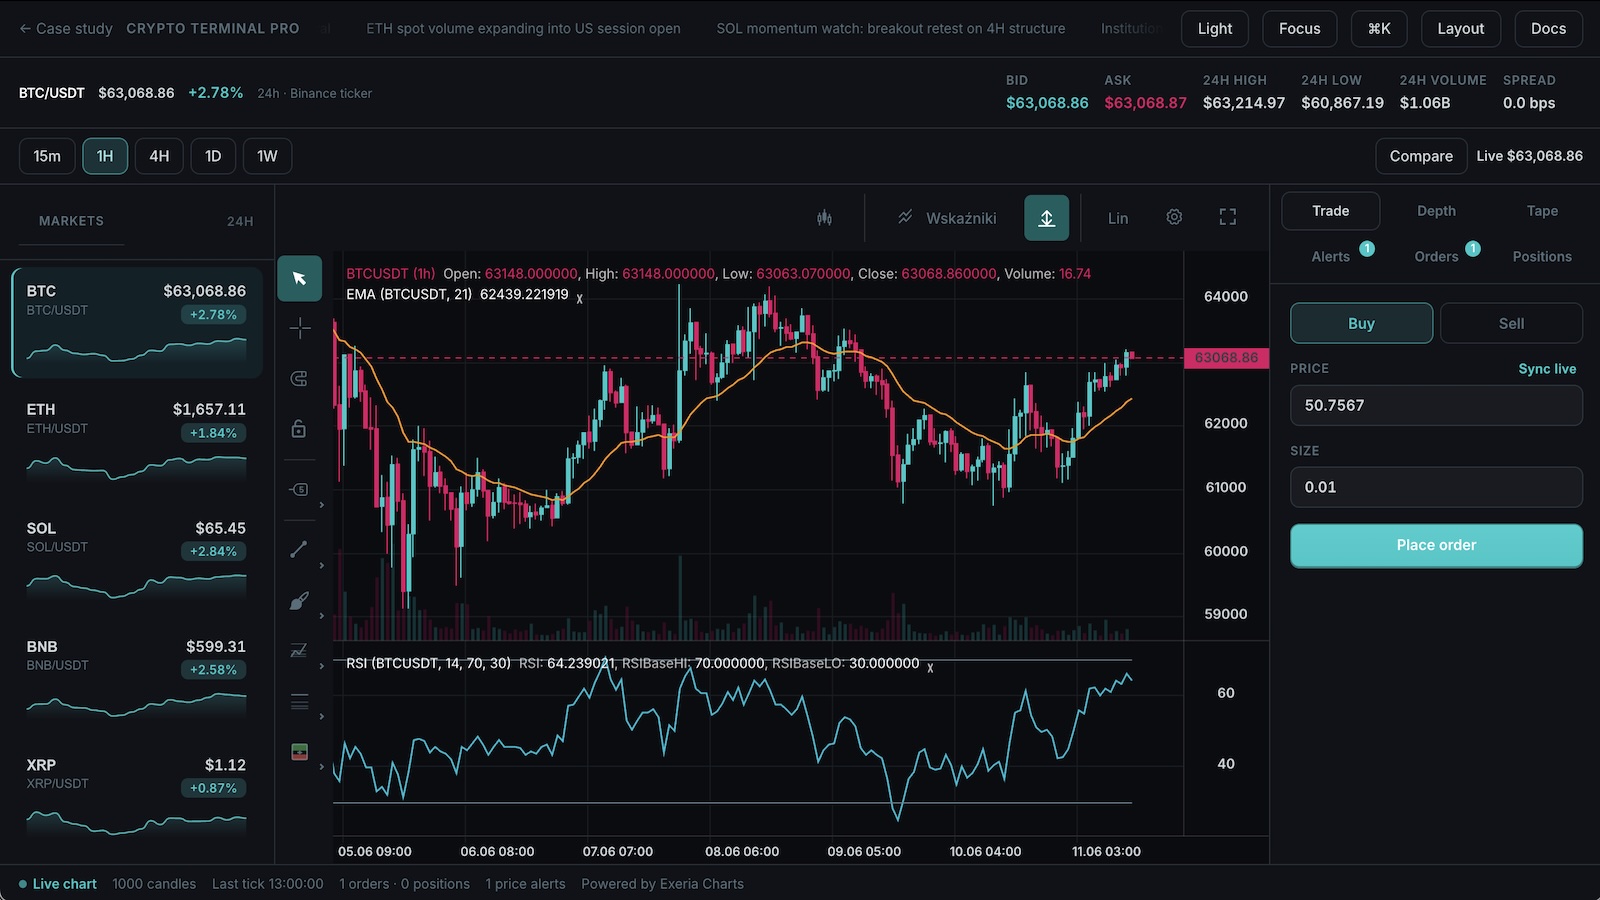
Deliver the institutional-grade trading experience. Seamlessly handle millions of simultaneous tick streams and execute trades at ultra-low latency. Perfect for centralized exchanges and high-performance DEXs.
View Implementation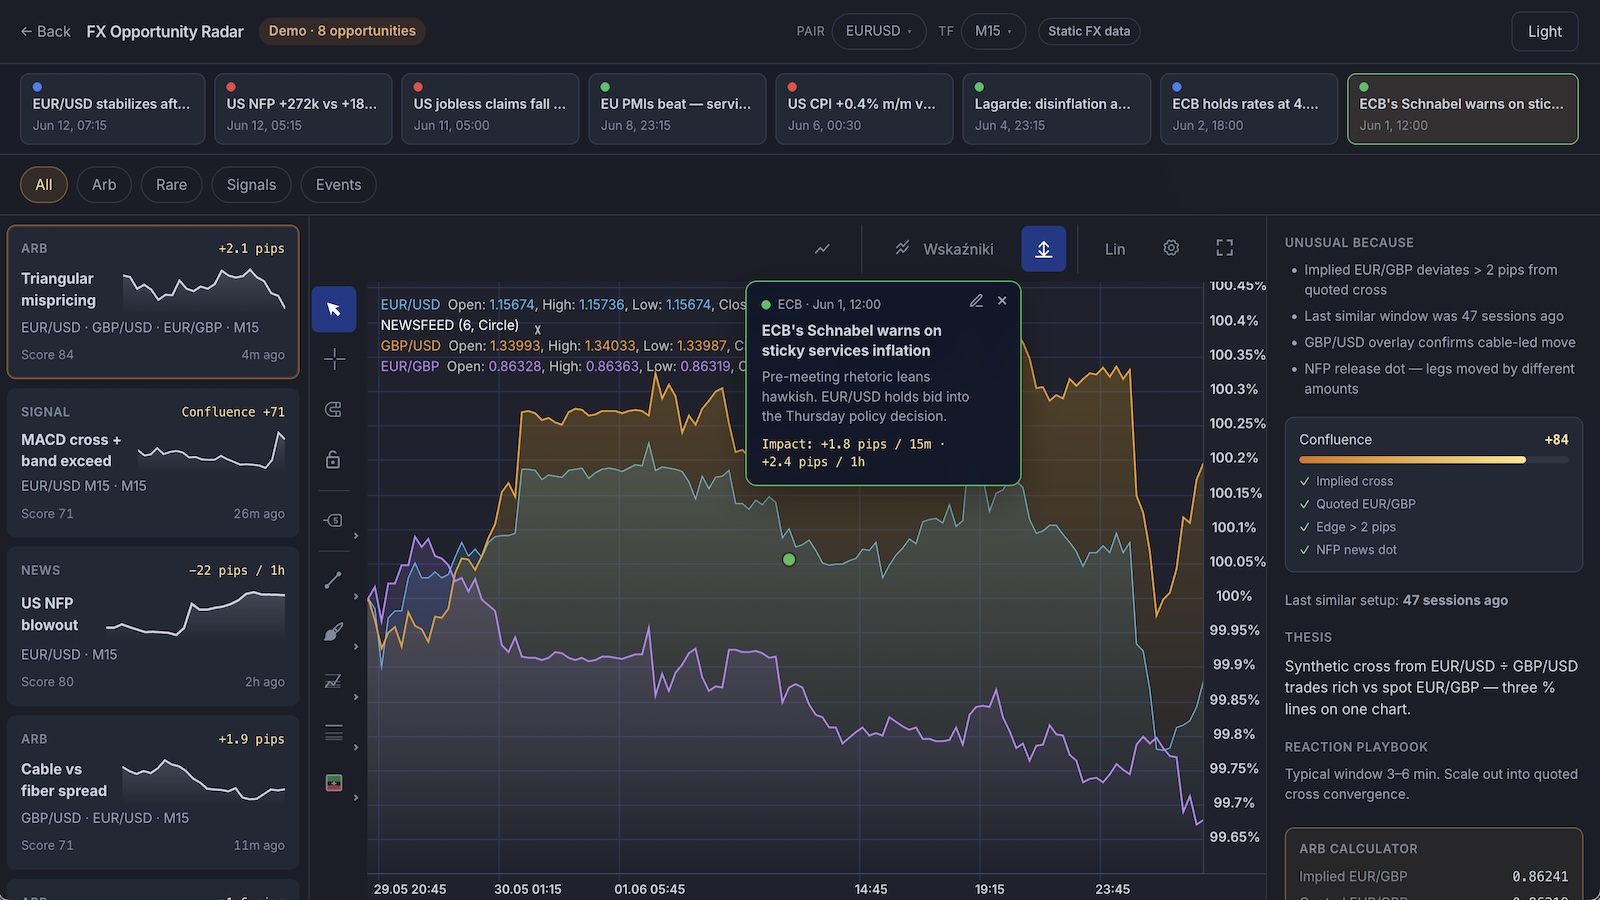
Surface triangular mispricings, rare setups, strategy markers, and macro news dots on one canvas — then download the starter and wire your own opportunity feed.
View Implementation
Embed stunning, minimalist charts directly into your banking or wealth management app. Designed for simplicity, our touch-first, lightweight charts provide a flawless mobile experience for retail investors.
View Implementation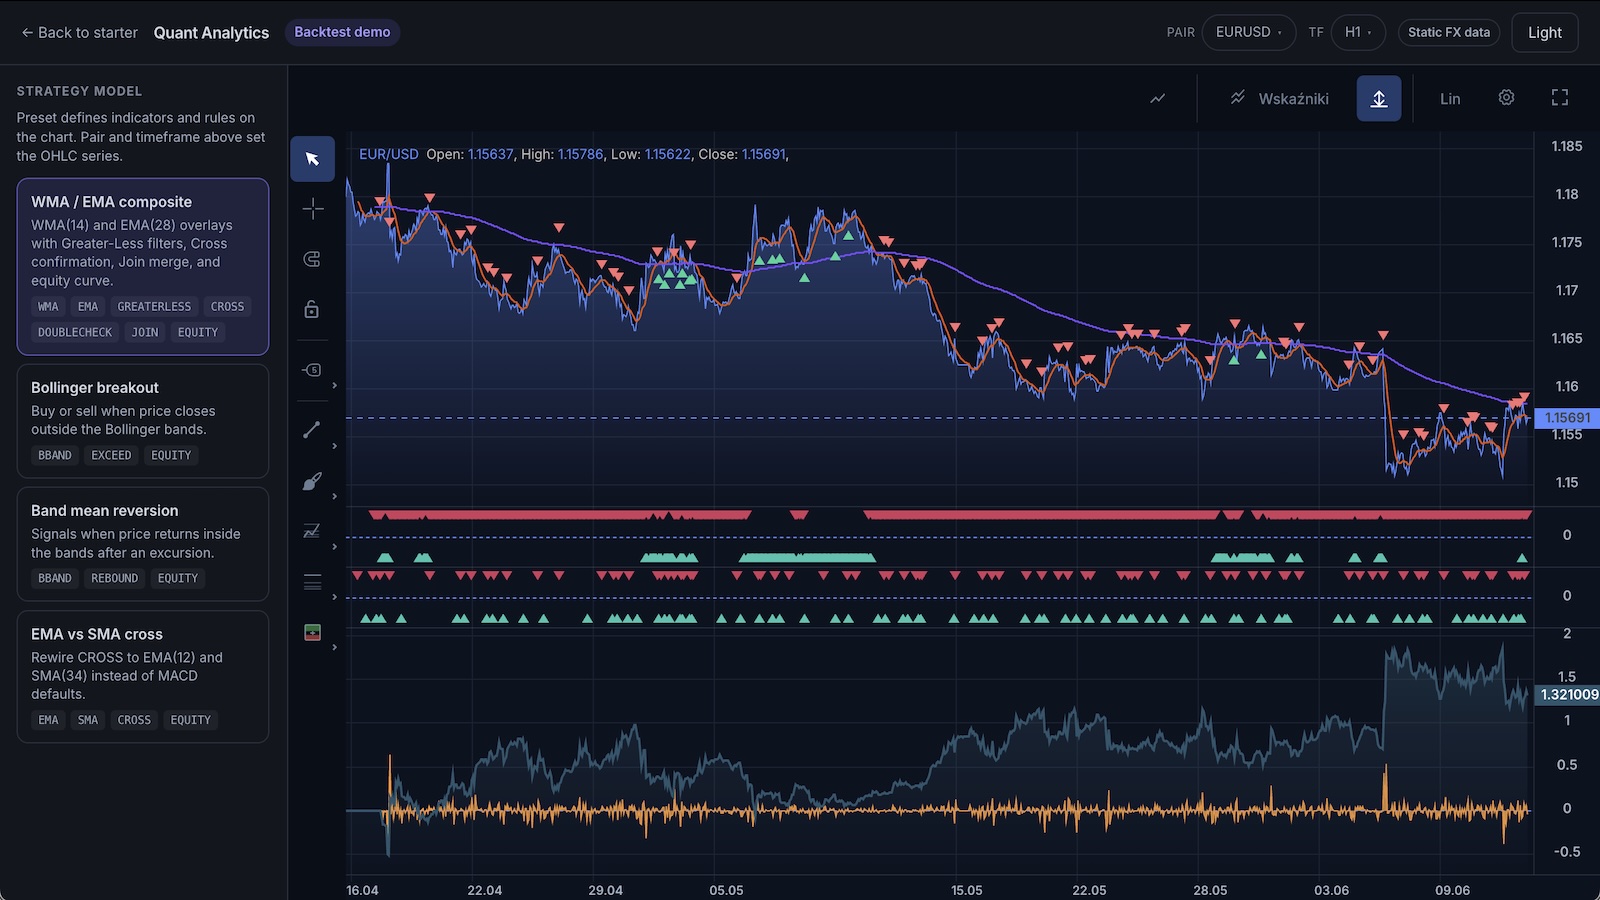
Visualize backtest results, equity curves, and algorithmic indicators over historical FX data — then download the starter and wire your own strategies.
View Implementation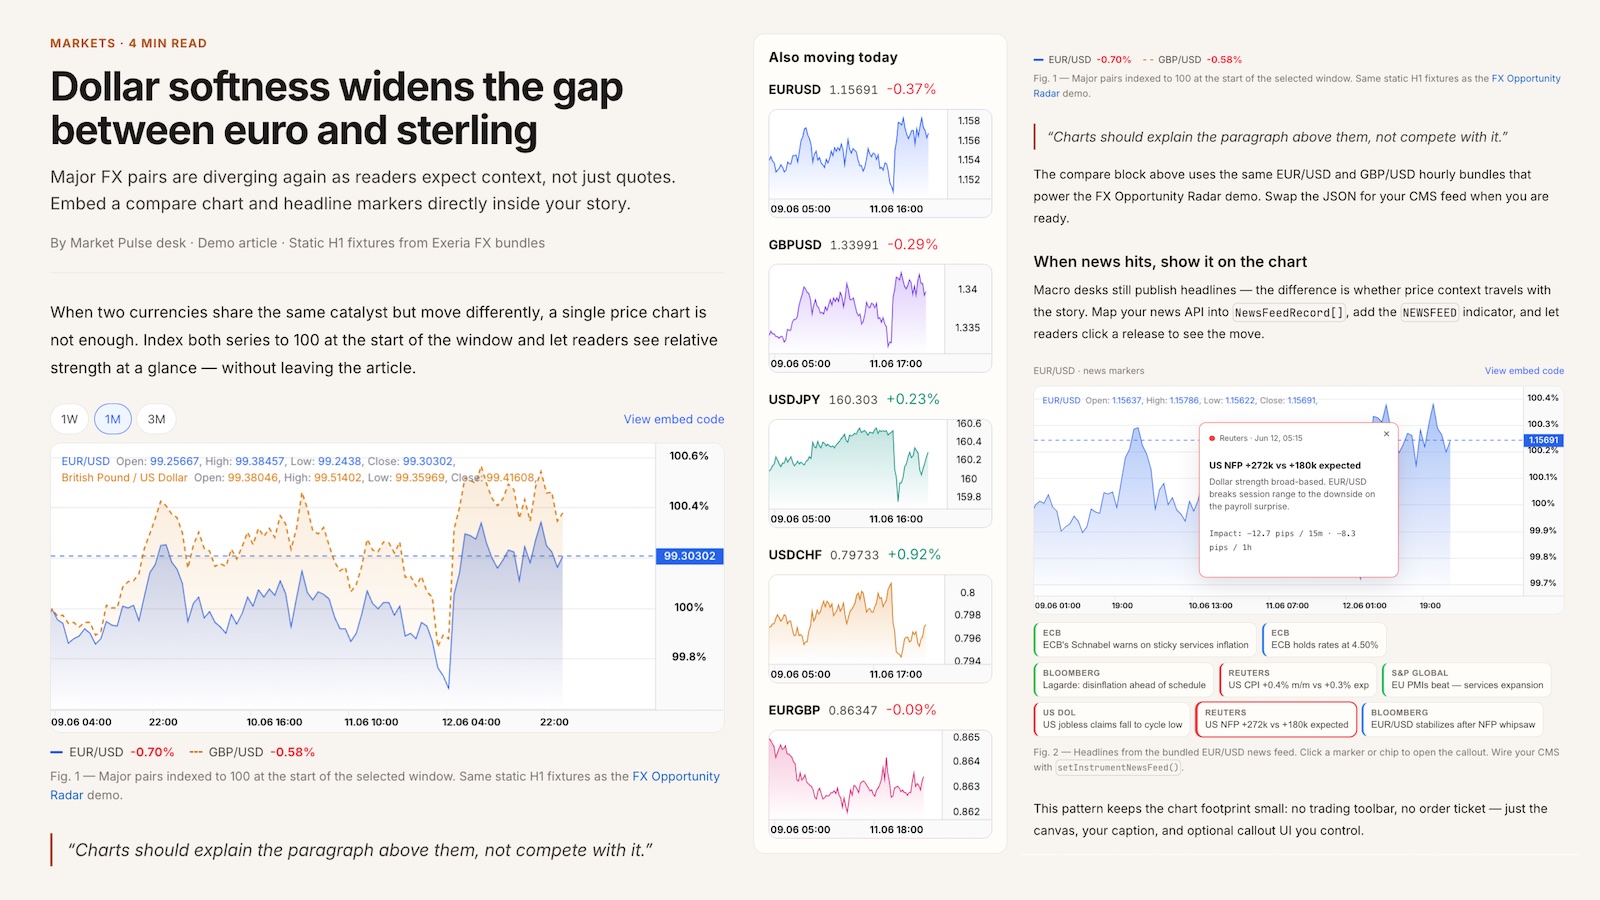
Keep readers on the story — embed indexed compare charts and headline markers without a trading terminal. Download the starter and wire your CMS feed.
View Implementation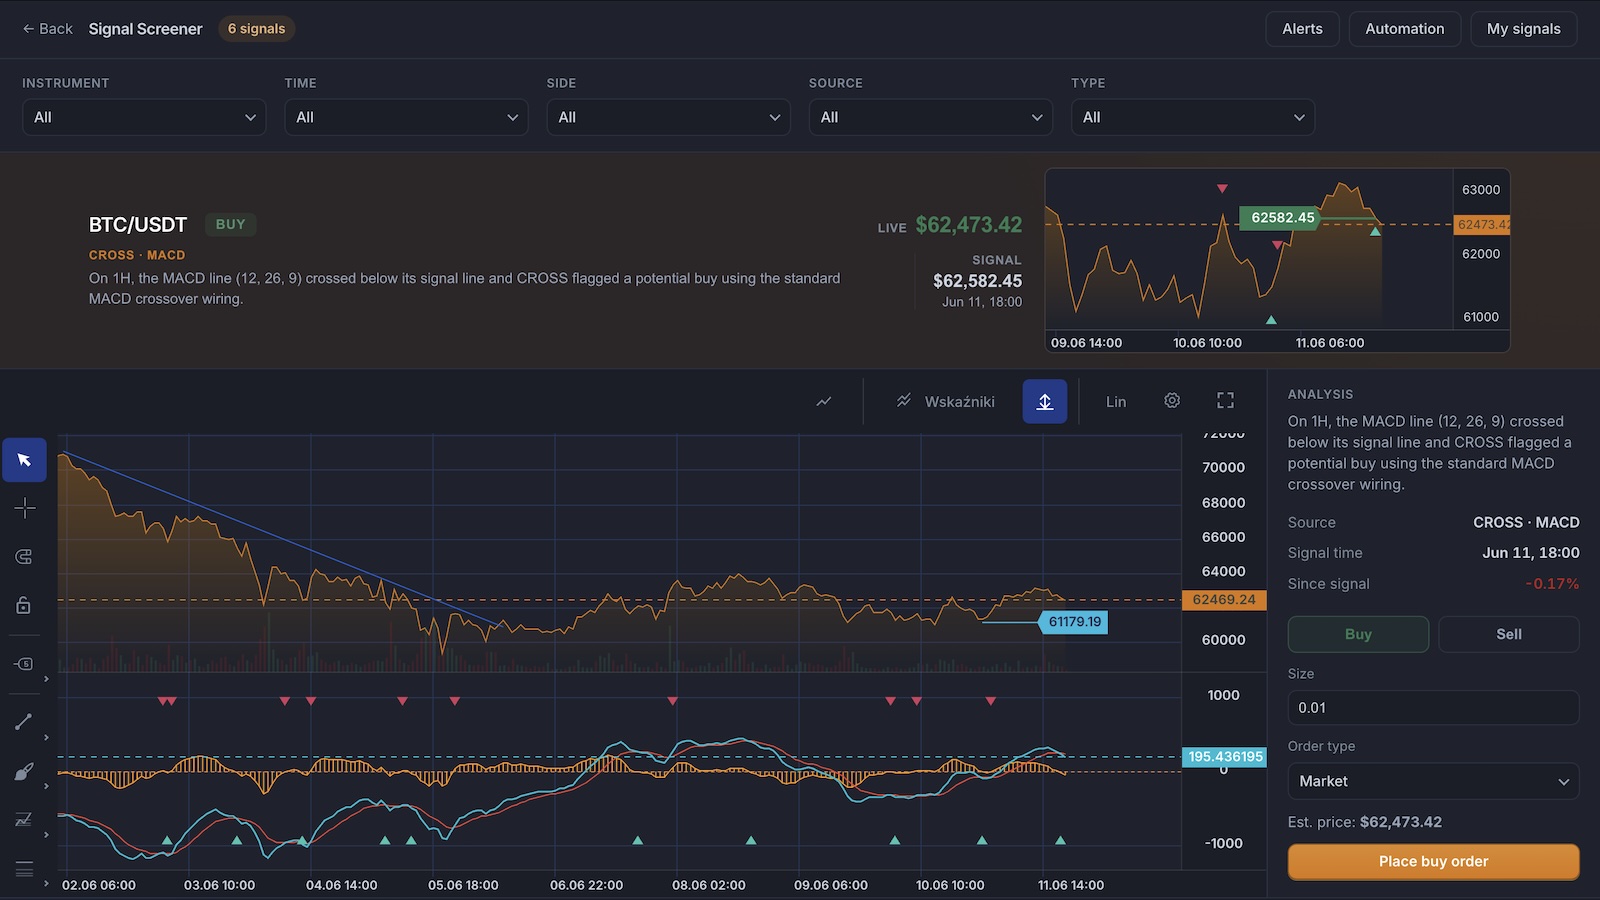
A signal screener you can run locally in minutes: filterable feed, mini charts, expandable analysis, and built-in strategy markers. Download the zip, edit React files, and connect your alert backend.
View ImplementationUse the full charting engine under AGPL v3 for open and experimental work. Need a proprietary product? A commercial license lets you keep your code closed—with startup-friendly pricing for small teams.
Open Source (AGPL v3)
Free connectors for instant market data
Commercial license
Mount the runtime, load candles, switch draw modes, and keep the rest of the surface in your own app shell.
Open guide →Create the runtime instance in React, then layer the toolbar and left-menu controls on top.
Open guide →Use the runtime and optional ChartUI wrapper in a browser-only React app with minimal bundler ceremony.
Open guide →Keep the chart inside a client boundary, avoid SSR pitfalls, and stream the rest of the route from the server.
Open guide →Understand AGPL obligations, MIT Data Connector packages, and when you need a commercial license for closed-source products.
Read licensing guide →Ship faster with MIT connectors for public and freemium market data—or use a commercial license to keep your app closed source.
Open guide →